Mapping and monitoring the ocean floor
Multibeam echosounder
PRE-COLLAPSE uses multibeam bathymetry and backscatter data for the inspection of the ocean floor morphology. With ship-based multibeam echosounder surveys they can identify seafloor structures produced by volcanic, tectonic, or sedimentological activity to constrain the geological processes that control volcanic flank (in)stability. There is a lot happening at the continental slope and with repeated bathymetric surveysit is possible to detect changes at the seafloor, such as landslides and possibly also movement of the volcano flank along geological faults.
Hydroacoustic data from ship based multibeam echosounder
A multibeam echosounder is an active sonar system. The multiple physical sensors of the sonar send and receive sound pulses that map the seafloor or detect other objects. A multibeam array is usually mounted directly on the hull of a research vessel or tower behind the stern. A multibeam sonar simultaneously sends out multiple sonar beams (sound waves) in a fan-shaped pattern, covering the space both directly under the ship and out to the sides.
Multibeam collects two types of data: bathymetry (seafloor depth) and backscatter. The bathymetry is computed by measuring the time it takes for the sound to leave the array, hit the seafloor, and return to the array by using the sound velocity in the water column.
Backscatter is a measurement of the intensity of the sound echo that reflects back from the seafloor to the multibeam array. This is dependent on geophysical properties of the seafloor surface and immediate subsurface of the seafloor. For example, hard materials, such as basement rock will generally reflect more sound than a softer material like sediment, for example fresh tephra or thick biogenic growth.
Derivative products of swath bathymetry are slope, hillshaded relief, and rugosity maps. These provide information not only on water depth, but also the roughness and smoothness of the seafloor, which correlates with the seafloor texture and depositional environment. These maps provide an overview of study areas and are used to decide the location of coring and additional geophysical surveying (introduced below).
Computers on the ship collect the hydroacoustic data and the researchers process the data to visualise the seafloor with two- or three- dimensional bathymetry maps as this example of ship based multibeam data collected during ALKOR cruise 532, gridded at 40 m spacing.


Artistic impression of the AUV Abyss performing a deep-sea multibeam survey (Tom Kwasnitschka/Nico Augustin, GEOMAR)
AUV Abyss being launched into the sea by the RV ALKOR in front of Etna volcano.
High-resolution mapping with AUV multibeam echosounder
High-resolution multibeam echosounder data can be collected with GEOMAR's Autonomous Underwater Vehicle (AUV) ABYSS. With this technique, the seafloor is sampled in the immediate vicinity of only a few tens of meters, which only allows a smaller coverage, but by using a higher frequency, a much higher resolution and better data quality is obtained.
The Abyss AUV was deployed offshore Etna to map an assumed active tectonic structure between the stable slope and unstable submarine volcanic flank during RV Alkor cruise 532 in January 2020. This detailed dataset facilitated the placement of geodetic stations (introduced below).

(Foto: Alessandro Bonforte)
Ocean Bottom Seismometers
GEOMAR’s OBS systems
Ocean bottom seismometers (OBS) are autonomous seafloor instruments, that record compressional P- and shear S-waves reflected and refracted through the sediment. The OBS devices get installed on the seafloor for long-term observations of up to several years and work down to 6 km water depths. The device contains several instruments such as a seismometer and hydrophone alongside instruments to recover the OBS after deployment. All sensors are connected to a recording unit and continuously record the incoming seismic signals. The OBS system is buoyant in the water and a weight is attached to it to be held on the ocean floor until it gets recovered with an acoustic release system at the end of the measurement campaign.
In the periods 2016 to 2017 and 2020 to 2022 six OBS were deployed offshore Etna Volcano right around the geodesy network to record seismicity within and in its immediate vicinity. Since 2022, a total of 16 GEOMAR OBS are distributed over a larger area in order to monitor regional seismicity until January 2023 in collaboration with the FOCUS project.

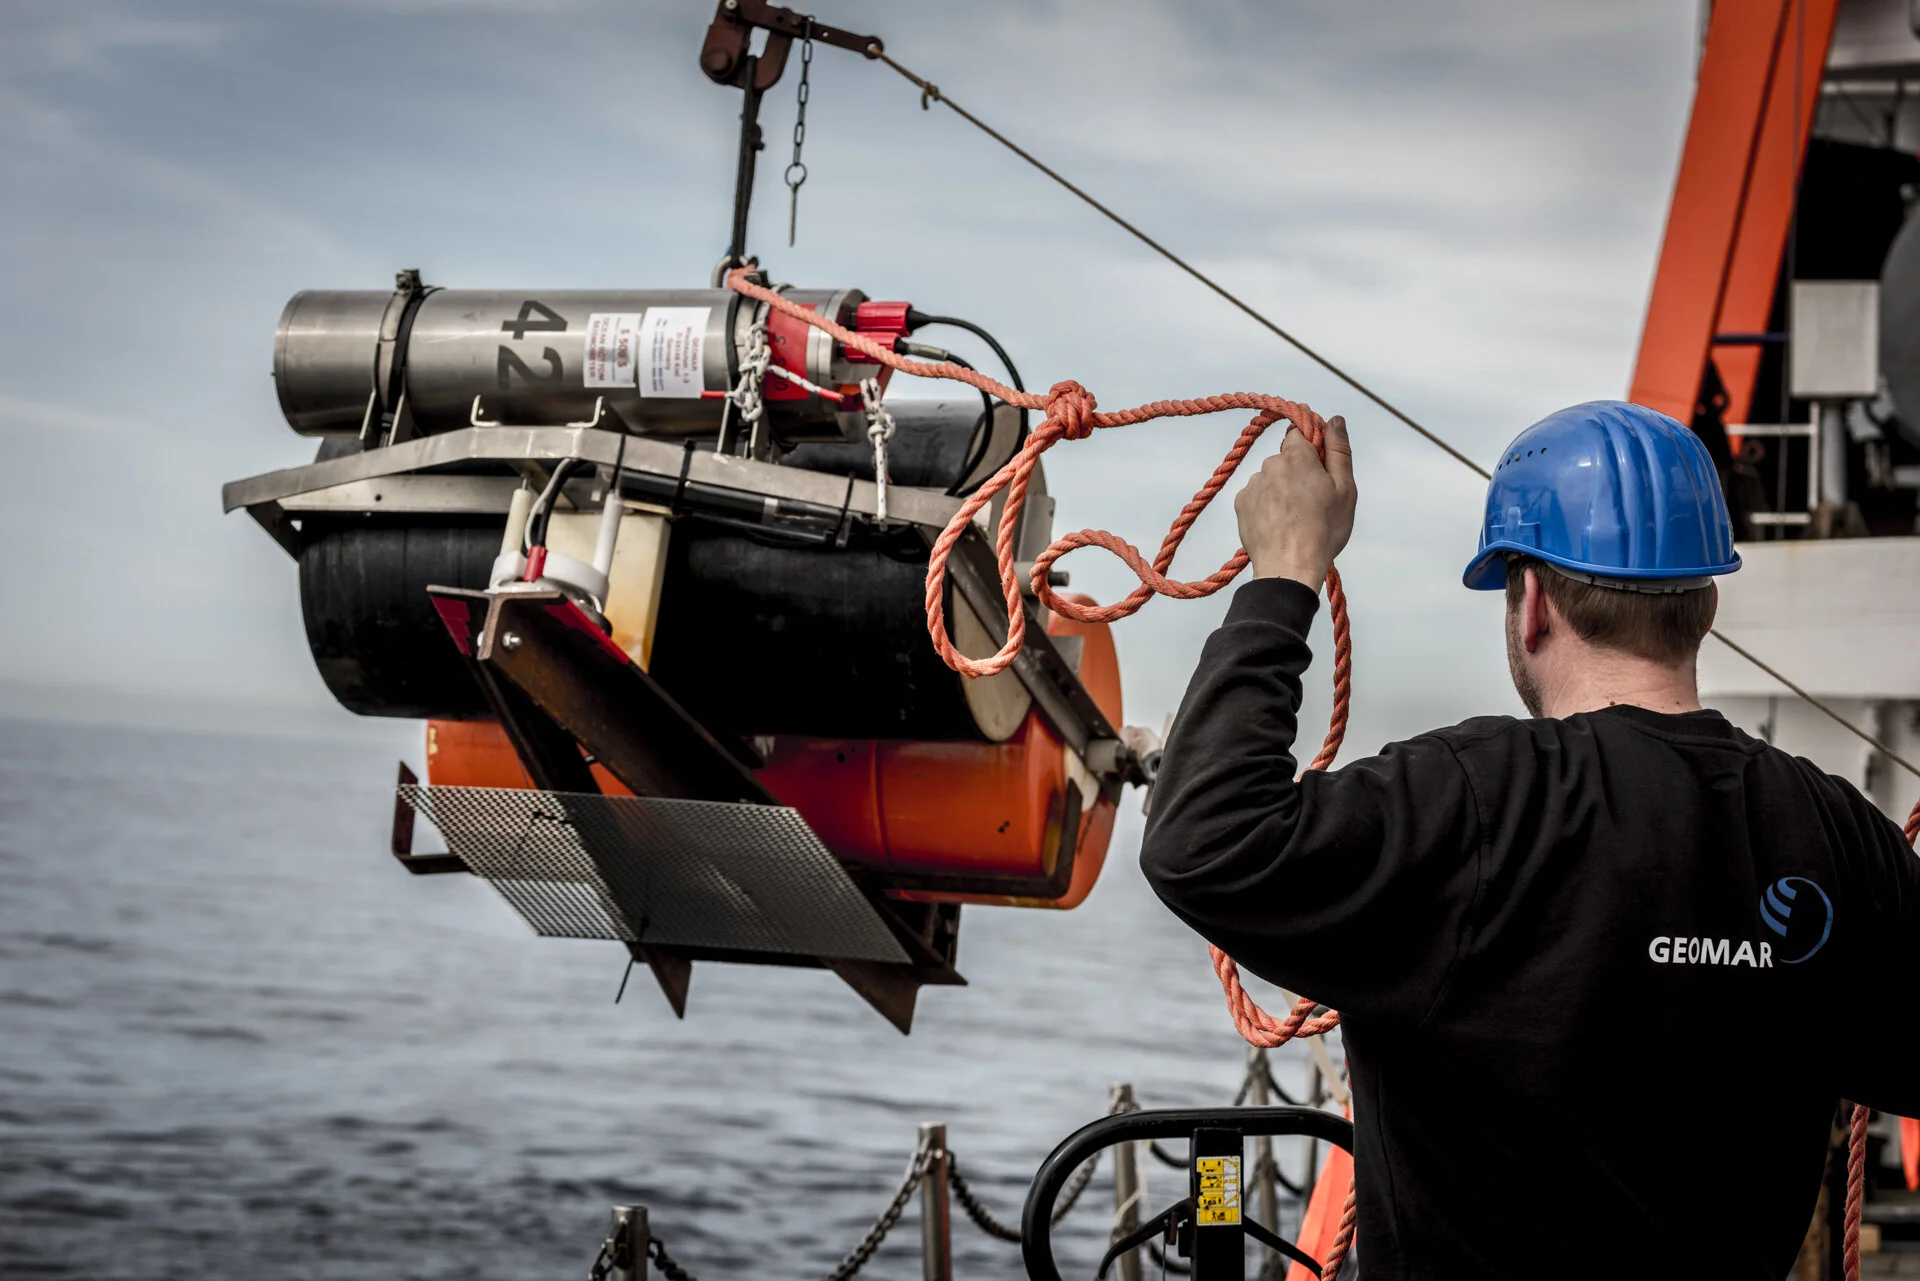
OBS launched during Sonne cruise in 2020. When deployed an anchor is attached by a releaser to the frame with the orange buoyancy bodies. The flashlight, radio transmitter and flag are used to localise the floating OBS close to the ship during recovery.

During Sonne Cruise 2020 six OBS were deployed offshore Etna Volcano to recorded microseismic activity in the vicinity of the seafloor geodesy stations along an active offshore fault for one year. (OBS data example from Malta, cruise report SO277)
Reflection Seismic Imaging
To image the features of the marine subsurface and finally interpret how it may have developed over time, the reflecion of seismic waves is used.
A seismic pulses is generated by an airgun towed behind a vessel. This sound wave travels through the subsurface and is reflected back to the surface at layer boundaries. Such boundaries are characterised by variations in density and seismic velocity. The returning pulses are picked up by an array of geophones attached to lines towed by a ship (P-Cable-Sytsem). These streamers record the amplitude and arrival times of the returned (reflected /refracted) seismic wave signals.
Since seismic waves travel in all direction, substantial seismic processing is necessary to obtain a proper image of the subsurface. Ultimately, the reflection seismic method can be combined with bore hole data that provide information about the seismic velocity of the subsurface and images can be produced not in the time but in the depth-domain.
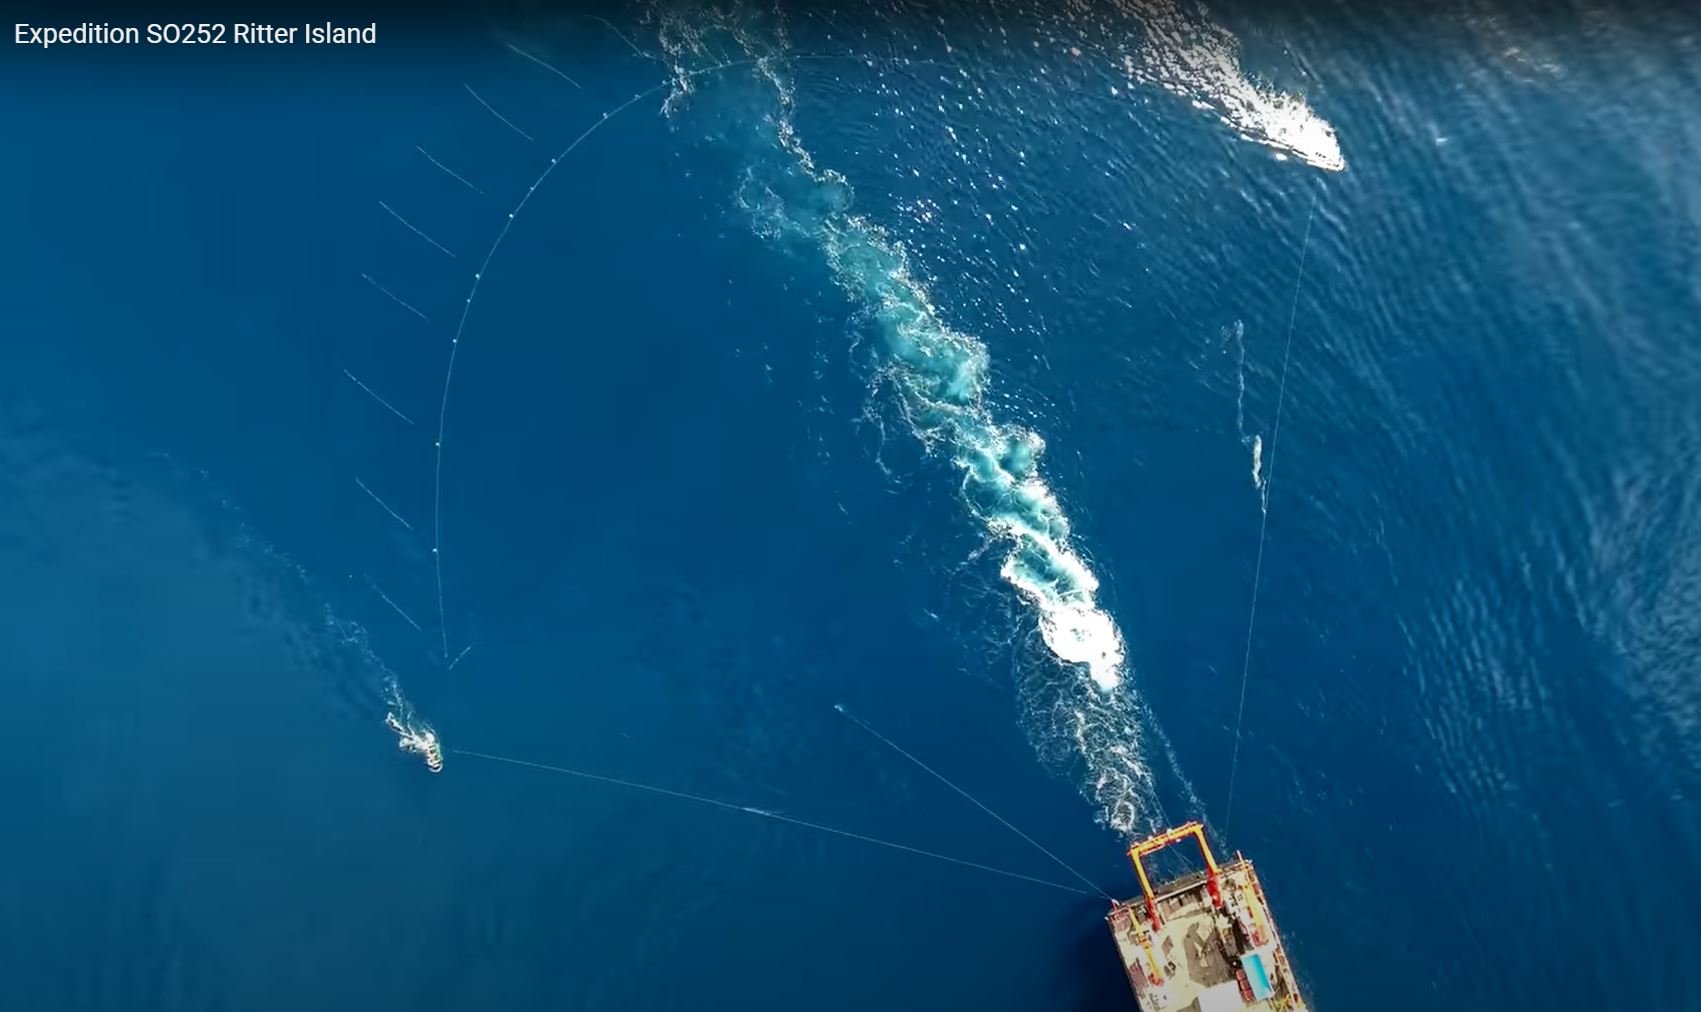
During cruise SO252 with research vessil R/V Sonne in 2016, high-resolution 3D seismic data were acquired with the GEOMAR P-Cable system at the region north-west of Ritter Island, covering the main deposit of the Ritter Island flank collapse.

Basic application of seismic data acquisition in a marine setting (openlearn.open.ac.uk)

Seismic sources: Two standard GI-Guns operated during the cruise SO252. (Picture: Melanie Ray)
In their study The Hidden Giant: How a rift pulse triggered a cascade of sector collapses and voluminous secondary mass- transport events in the early evolution of Santorini, Jonas Preine (University of Hamburg), Jens Karstens (PRE-COLLAPSE, GEOMAR) and other authors used an extensive dataset of high- resolution seismic profiles to unravel the distribution and internal architecture of this huge deposit west and east of Santorini.

Seismic Profiles in the Christiana Basin (Santorin), Preine et al., 2022.
The catastrophic 1888 Ritter Island volcanic sector collapse triggered a regionally damaging tsunami. 3D seismic interpretations and sedimentological analyses were used to constrain numerical simulations of the collapse that supported the tsunami modelling.

Seismic profile covering the edifice of Ritter Island that partially collapsed in 1888 causing a tsunmai. It shows the deformed seafloor sediments (yellow), and the volcanic ridge (red) to the west.
The data are based on the interpretation of high-resolution 2D and P-Cable 3D seismic data acquired during expedition SO252 of research vessil R/V SONNE in 2016. (Karstens et al., 2020)
GeoSEA
GEOMAR's seafloor geodesy network
Satellite-based geodetic tools such as GPS use electromagnetic waves that do not penetrate the seawater. Sound waves however can. The sonar-based underwater system GeoSEA SEAfloor GEOdesy network is a network of high-precision acoustic autonomous monitoring transponders (AMT, Sonardyne)- that are placed on the ocean floor. They measure the travel time of acoustic signals between one another and take water sound speed, temperature, and absolute pressure into account. By recording data over months to years, displacements between the positions of the individual transponders can be detected. Changes in acoustic distances reflect deformation of the seafloor.

(Felix Gross)

Time series of acoustic distance measurements from one transponder pair at the seafloor offshore Etna volcano, that recorded a deformation phase of more than 4 cm in May 2017. It was the first sub-sea surface measurement worldwide of such a slow-slip event at the flank of a volcano (Urlaub et al., 2018).

A seafloor geodetic station is launched from research vessel RV POSEIDON to be positioned on the ocean floor at Etna’s southeastern slope at 900 m water depth. (picture: Felix Gross)
Since 2016 five of these seafloor geodetic stations are positioned offshore the East Coast of Etna, Sicily, on both sides of a prominent fault, the Alfeo-fault. It marks the border between a slipping part of Etna’s volcanic flank in the north and the assumed not moving and thus stable southern part. Hence, the movement of one side with respect to the other side of the fault is represented by the distance changes between the five stations that were placed strategically on structural heights around the active fault.

Position of Geodesy stations along the Alfeo fault on structural heights. For more details see map below.
Monitoring the onshore faults
Creepmeters
Complementary to the offshore GeoSEA array, also on land, displacements of the fault system that marks the southern boundary of Etna’s unstable flank is measured. In July 2022, two IPOC-type creepmeters have been installed near the coast across the Timpe Fault Systems and another one is planned to be installed at the Tremestieri-Trecastagni Fault System to best understand the complex behaviour of the distributed faulting onshore. Both arrays will stay for the same observation period of the upcoming three to five years.
For the creepmeter installation, nine metre long rods are buried 1-2 m in the soil across the fault. They can detect very small movements of the ground with micrometre precision. A system monitors the relative displacement of the free end of the rod relative to the fixed endpoint. The fault slip is calculated as relative movement of the ground on either side of the fault plane. The creepmeters make two measurements per minute and therefore can detect the slip rate in a high temporal resolution. The Instruments are powered by a solar panel and the data are transmitted via a mobile phone connection that provides direct data access at GFZ Potsdam.
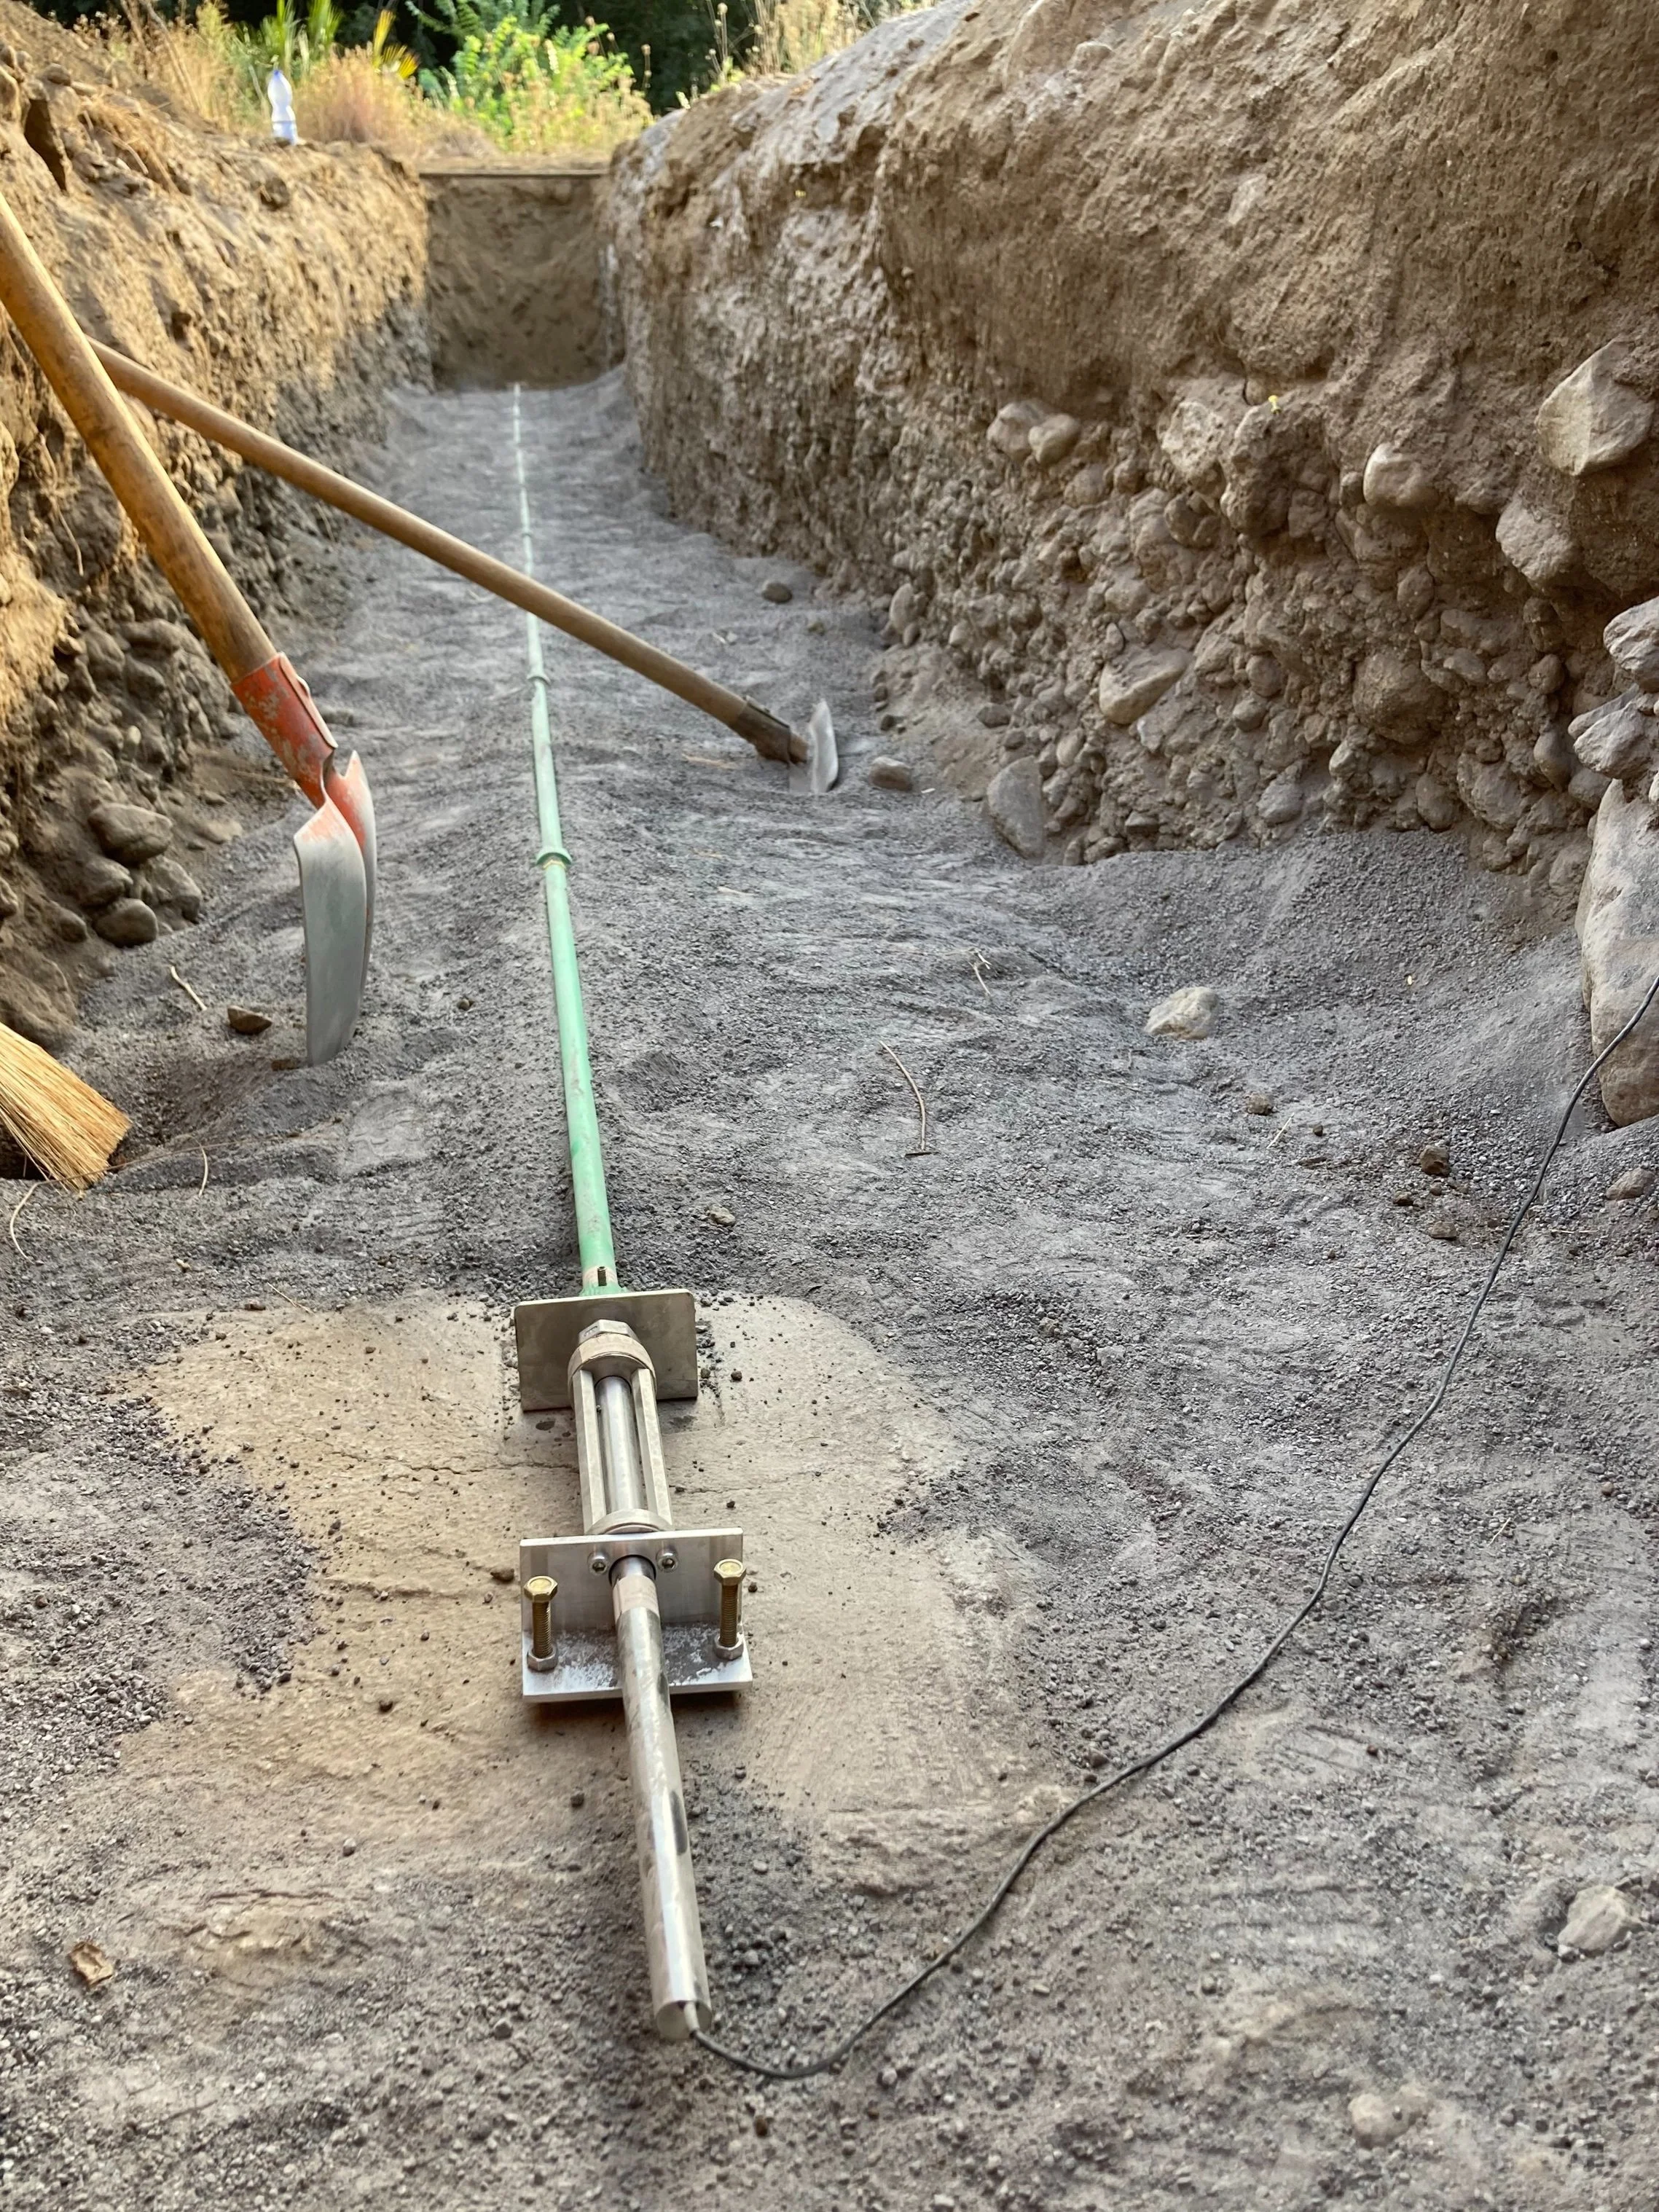
Creepmeter with sensor in the front and rod crossing the fault. (picture: Pia Victor)

Fault creep is the term for the slow, constant slippage that can occur on some active faults without there being a rupture and thus earthquakes. Creeping behaviour happens on all kinds of faults, but it is most obvious and easiest to visualise on strike-slip faults, which are vertical cracks in the earth crust whose opposite sides move sideways with respect to each other, such as those at Etna’s eastern flank. Aseismic creeping occurs constantly and also in episodic events that last for several days. These can occur after major earthquakes such as in the case of the 2018 Mw 4.9 Fleri earthquake, but can also happen without any preceding seismicity. The monitored Macchia fault is a creeping fault but also experienced shallow seismic rupture in the last centuries.
Numerical Modeling
A model is a theoretical approach to imitate nature. Researchers design a computer program as a model and use it to carry out simulations.
The model is a reproduction of reality, the physics in mathematical equations. To imitate more complex relationships many such equations are required. These are translated into a mathematical and then, a computational language- coded. The result is the numerical model, a computer program. It sets the boundary conditions for a simulation. When a model is generated, the researcher first decides which factors they want to ignore or neglect, so it will not be too complicated to compute later. Therefore the model is always a simplification of reality. The computer program includes all the simplified equations that are needed to explain the reality in the best possible way.
With the models they design, researchers can simulate how a system works and what happens when certain parameters are changed. When chaotic conditions prevail in a system, one small change can have a huge, unpredictable impact on the events and their outcome. One example of this is the dynamics of fluid systems, used to elucidate weather and ocean currents as well as magma movement or cooling systems. As soon as turbulence arises, things get very complicated. If a fluid flows past an obstacle, eddies form; then the smallest factors can influence which side of the obstacle the fluid flows past. Such a system can be so sensitive to the slightest changes that multiple runs of the simulation yield completely different results.
Boundary Element model for Dynamic Dike Propagation
Coupling different numerical approaches to encompass magmatic, tectonic and slope processes in a single model
Investigating the influence of slow sliding of volcanic flanks on the magmatic system - how do magma transfers affect the internal structures and surface features of a volcanic edifice?
Flank instability and collapses affect and are affected by magmatic activity.
During a volcanic flank collapse, huge rock masses are released, causing lithostatic unloading which influences the stress regime of the volcanic edifice in short term. This in turn leads to changes in the elastic energy and can induce fractures or their propagation and causes pressure decrease within a magma chamber and dike intrusions. This can trigger eruptions or changes in the magma composition and eruptive style. This has been proven by the long-term eruptive histories of many volcanoes.
In turn, Dyke intrusions have the potential to destabilise the flanks of a volcano.
Previously numerical modelling has linked short-term redistribution of surface loads, such as partial destruction of edifices or flank collapses, to eruption initiation and changes in eruption style.
Severine Furst has developed a two dimensional boundary element model for dynamic dike propagation with Virginie Pinel at the Institut des Sciences de la Terre, Grenoble (ISTerre) and Francesco Maccaferri (INGV, Napoli). This approach models the propagation of a fracture filled with a viscous fluid in a brittle elastic media subjected to external stress.
In reality, this fracture is a volcanic dike, the pathway for magma inside the volcano.
Volcanic dikes cropping out at Etna volcano (left) and dikes as pathways for magma inside the volcano (right). The sheet of igneous rock cuts across older beds of volcanic rock. After magma had filled the fractures, it cooled and solidified. Erosion exposes the dike as a natural wall or ridge.
To study their dynamics, the researchers use models to represent the geometry and the processes involved in diking. In the recent model Séverine Furst developes, the dike is assimilated to a series of small, two dimensional patches that can open (be widened) with respect to the internal fluid pressure and surrounding stress of the medium. The dike is discetized into small interacting units.
The output of the model are the energy release during the dike propagation, the preferred pathway of the dike and the velocity of propagation. With this model, the researchers can access the shape of the crack (length, opening), its trajectory and velocity of propagation.
These information will help to better constrain the time and location of the dike arrival at the surface. It will contribute to mitigating volcanic hazards associated with the creation of new eruptive vents.
Knowing the path, shape and velocity of the dike also provides us with information about the stress induced by the moving magma that can be used as input data for a flank collapse model. The stress perturbation can affect the surface structures of the volcanic edifice, which can in turn favour or hamper flank sliding.
In turn, the stress induced by volcanic flank sliding will serve as a constrain in the numerical model for dike propagation: it could influence the travel of the magma like allowing its propagation, increasing its velocity, bending its trajectory or even arresting it.
In the model, the dike is assimilated to a series of adjacent and interacting dislocation elements in which the researchers consider a viscous fluid flow. The proportions of the dikes are largely greater than that of the opening of the dike.
The dike opens under assigned normal and shear stress given by the internal overpressure and by the normal and shear component of the stress field acting within the rock. The numerical dike propagates by adding a new dislocation element at the tip of the dike in the direction that maximizes the energy release of the system. The fluid flow results in a viscous pressure drop applied to the crack wall, which modifies the crack shape and contributes to the energy balance of the propagating dike. The model gives the following output: The energy release during the propagation, the preferred pathway of the dike and the velocity of propagation. The models currently account for: the propagation of a finite volume of viscous fluid (constant mass of fluid); compressibility of the fluid; fluid buoyancy; density layering (of the hosting rock); elastic layering (of the hosting rock); fracture toughness; external stress field; stress induced by topographic loads; the propagation along an imposed trajectory; the propagation at a prescribed velocity.
Furst S., Maccaferri F., Pinel V., Modeling the dynamic propagation of magmatic intrusion, a new 2D numerical approach, JGR: Solid Earth (submitted soon)
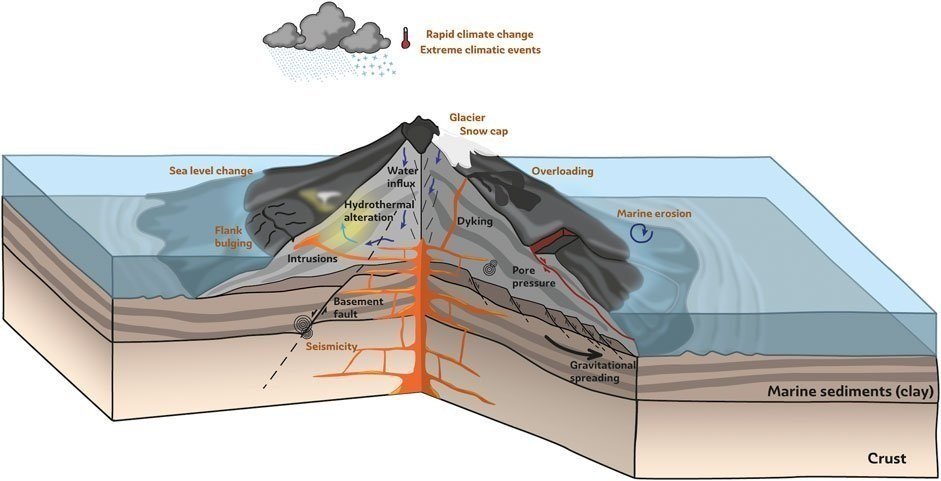
Cartoon (not to scale) illustrating the structures of oceanic volcanoes along with the different endogenetic (in black) and exogenetic (in brown) preconditioning factors of volcano collapse (based on McGuire, 1996; Keating and McGuire, 2000).
Finite-Element Models and Direct Shear Experiments
Volcanic rocks tend to be highly fractured and thus, volcanoes are thought to be unstable geological structures. Knowing the material properties is important for understanding the internal state of stability of a volcano.
To assess what triggers catastrophic flank collapses, we analyze the influence of the volcano’s material properties and geometry on the volcano stability using direct shear experiments and finite-element models.
Two-dimensional finite-element models are created using the commercial finite-element software ABAQUS. These models divide the volcano into discrete elements interconnected at nodes, enabling the calculation of displacements, strains, and stresses. This method is applied to the case study volcanoes Anak Krakatau (Indonesia) and Kilauea (Hawaii, USA).
Material properties for the models are partly derived from literature and partly from direct shear experiments. The direct shear experiments are conducted in collaboration with Dr. Matt J. Ikari at MARUM. Here, Giesa single-direct shear apparatuses are used. They provide insights into the material behavior, including velocity-weakening or velocity-strengthening characteristics, friction coefficients, and cohesion.
The data from these experiments is integrated into our finite-element models, enhancing their accuracy and relevance to the case studies.
Are the volcanic materials predestined for failure?

Measurement of quartz powder using the Giesa direct shear device at the Marine Geotechnics laboratory at MARUM. The graph indicates the coefficient of friction as a function of the sample displacement in mm. The peak friction coefficient, residual friction coefficient, and the five velocity steps done in this experiment are indicated.


Preparing the samples by grinding them to <125 µm using a mortar and a sieve.

Setting up the direct shear device by crewing the top and bottom plate together. The sample will be filled into the hole in the center of the two plates.

Close up view to the direct shear apparatus. Here you can see the two plates that are screwed together inserted in the apparatus.

Top view onto the lower plate with the sheared sample in the center
Worldwide database of morphometric parameters of volcanic islands
Systematic search for correlations between the morphology and the instability of volcanic islands by combining high-resolution bathymetry and topography data from various sources.
Various factors are known to influence the instability of a volcanic edifice. Investigations are often restricted to the subaerial parts of a volcano, due to the additional challenges involved in marine research. The majority of a volcanic island’s edifice, however, is submarine and needs to be included.
PRE COLLAPSE studies the morphology of the entire edifice, from summit to seafloor. Elisa Klein is searching systematically for correlations between the morphology and the instability of volcanic islands world-wide.
Systematic search for correlations between the morphology and the instability of volcanic islands
Combining high-resolution (50-100 m) bathymetry and topography data from various sources.
The ship-based source are for example Global Multi-Resolution Topography Data (GMRT) and The European Marine Observation and Data Network (EMODnet).
Where does the volcanic edifice start and where does the seafloor end?
We take the increase in slope as the main criterion for delineation of volcanic bases. The contour line at 3° slope can be calculated automatically. It is then edited further by hand to delete artefacts and separate edifices, which are too close together.
This approach has first been established by Roos v. Wees et al. and is explained in their 2021 EGU poster.
The 3° slope contour (dark blue line) is less sensitive to artefacts and small scale changes. River valleys (light blue) are good lineations for separating volcanic edifices.
Based on the determined outlines, basic morphometric parameters such as total height, area, volume, slope, etc. can be calculated and entered into a database. Once a statistically significant number of volcanoes have been studied, correlations can be sought between the morphometry of the volcanic edifice and the history of flank instability and lateral collapses.
With high resolution (HR) bathymetry data available only few well-mapped archipelagos can be investigated.
Therefore also the usefulness of satellite-derived low-resolution grids with global coverage, such as the General bathymetry Chart of the Ocean (GEBCO) is tested.
Volcanic islands for which high-resolution data are available are investigated in detail and will be segmented into flanks to investigate them separately.
This will enable us to determine, whether specific flanks (i.e. the steepest) are more likely to fail.
In the future we plan to include tectonic settings and environmental factors, such as rainfall patterns.